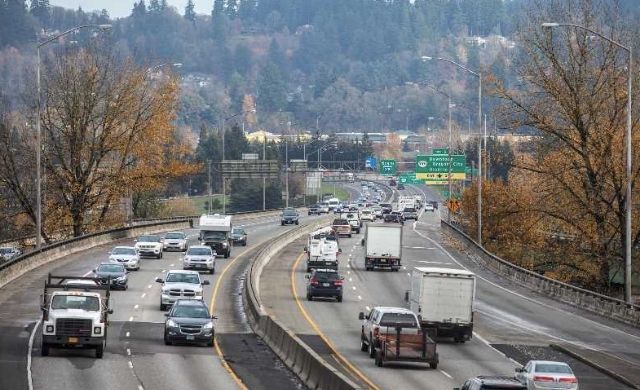
PORTLAND, Ore. (KOIN) — Speed limits through urban stretches of Oregon’s interstate highways are among the slowest in the U.S., a recent report by the Insurance Institute for Highway Safety shows.
City interstate speeds in Alaska, Connecticut, Delaware, Illinois, Indiana, Iowa, New Jersey, Oregon, Rhode Island, Vermont, West Virginia and Washington D.C. are tied for the nation’s slowest, with designated speeds of 55 mph.
Although state lawmakers are responsible for setting highway speeds, Oregon Department of Transportation spokesperson David House told KOIN 6 that ODOT has the authority to adjust traffic speeds for driver safety purposes. The changes can be made in response to many traffic-related issues, including: congestion, crash data and interchange locations.
“Excessive speed for conditions is historically the leading factor in fatal and serious-injury crashes,” House said. “Put simply, higher speed reduces reaction time for a driver and increases the severity of an impact. It can turn a near-miss into a crash, a fender-bender into an injury crash or an injury crash into a fatal crash.”
Studies conducted by engineers like Portland State University Professor Chris Monsere can also affect regional decisions to speed up or slow down traffic.
In 2018, Monsere led a preliminary analysis of the 2016 speed limit changes in Eastern Oregon. The state-funded study was conducted after state lawmakers agreed to increase Eastern Oregon driving speeds from 65 to 70 mph through areas of I-84, I-82 and Highway 95. That same year, Highways 20, 395 and 97 were also increased from 55 to 65 mph.
After analyzing four years of data, the study concluded that Oregon crashes resulting in death and serious injury increased by 75 percent on highways where speed zones were raised to 65 mph, the East Oregonian reports. Highways that increased to 70 mph also saw an increase of 36 percent.
By combining fatal and serious-injury crashes into one statistic, Monsere said, researchers were able to more accurately say how highway speeds impact driver safety in Oregon.
“Severe-injury crashes are usually significant events, and combined with fatal crashes, provide a better picture of safety,” he said. “The difference between a fatal crash and a severe one sometimes only depends on other factors: seatbelt use, driver age, overall health, the type of collision. There are usually not enough fatal crashes on any one segment of roadway to draw meaningful conclusions.”
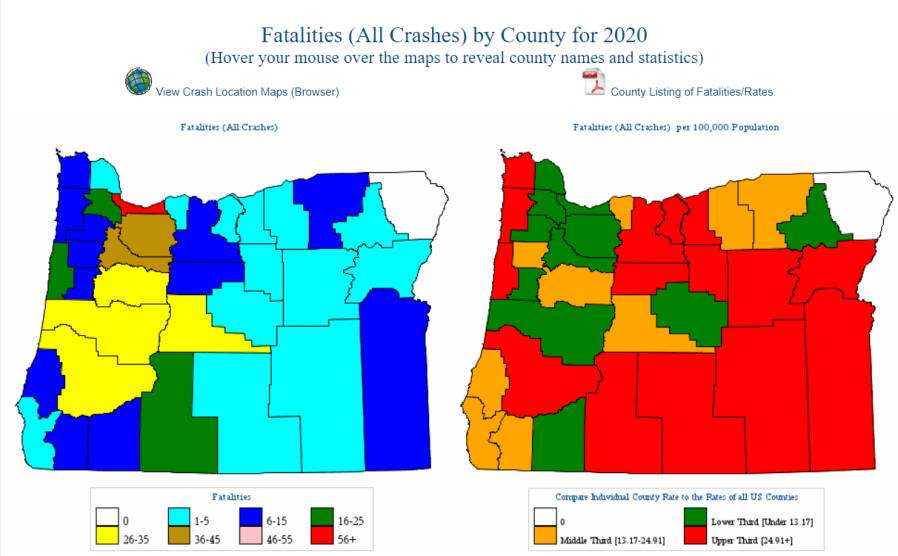
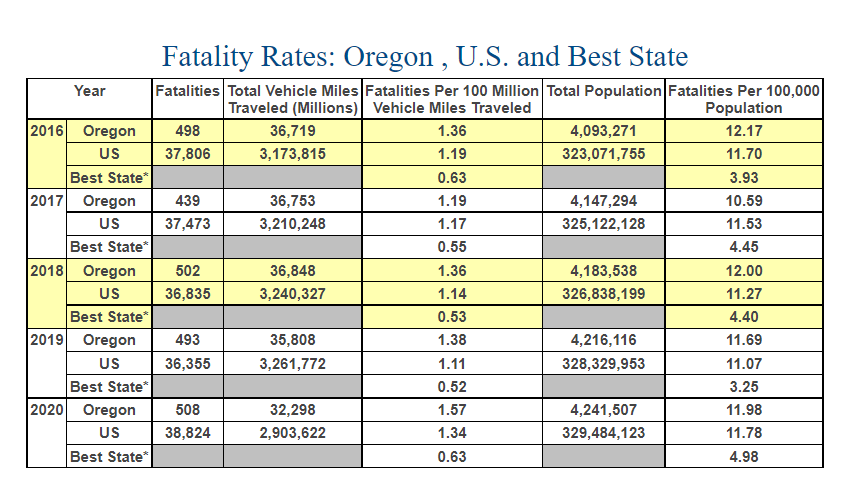
The National Highway Traffic Safety Administration reports that 2,440 people were killed in crashes on Oregon roadways between 2016 and 2020. During this time, NHTSA data shows that Oregon has consistently seen more traffic deaths per 100,000 people than the national average.
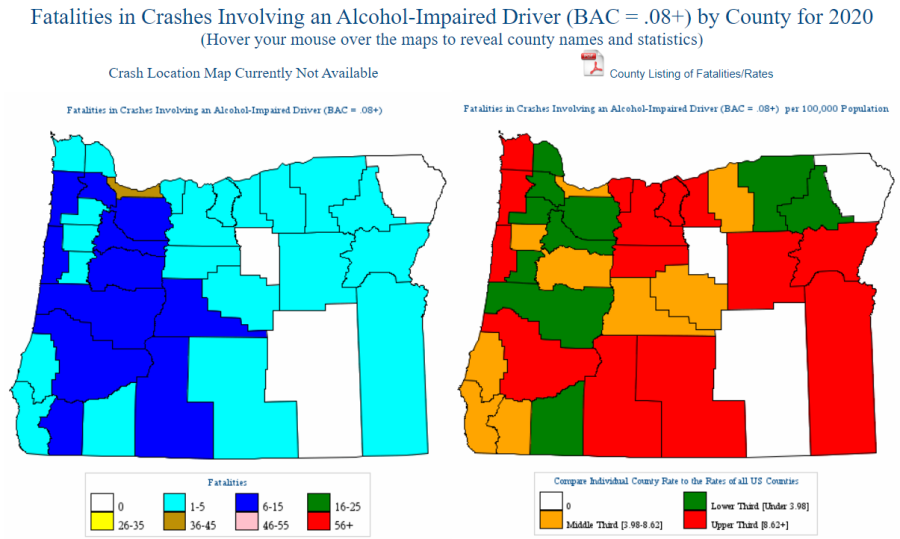
Fatal DUI-related crashes are also consistently more common in Oregon. In 2020, alcohol-impaired driving fatalities accounted for 38 percent of all traffic-related deaths in the state – 8 percent higher than the national average.
Read ODOT’s “2020 Oregon Motor Vehicle Traffic Crashes Quick Facts” for a deeper look at the most common causes for traffic collisions in the state.