PORTLAND, Ore. (KOIN) – With the report on the new climate normals released last week, we now have a “new normal” when it comes to changes in our seasons here in Portland.
We have now shifted from a 30-year bracket of 1981-2010 to 1991 to 2020. If you didn’t read the first article about the fresh climate normals, check that out here. The first article dives a little deeper into the process and what are some of the monthly changes that we have encountered here in Portland.

Now that we have this new set of data, we can break down the differences by seasons. This was done accomplished by using meteorological seasons and not astronomical. The four seasons are broken down into 3 months: Spring (March, April, May), Summer (June, July, August), Fall (September, October, November) and Winter (December, January, February).
CHECK OUT THE GRAPHIC BELOW
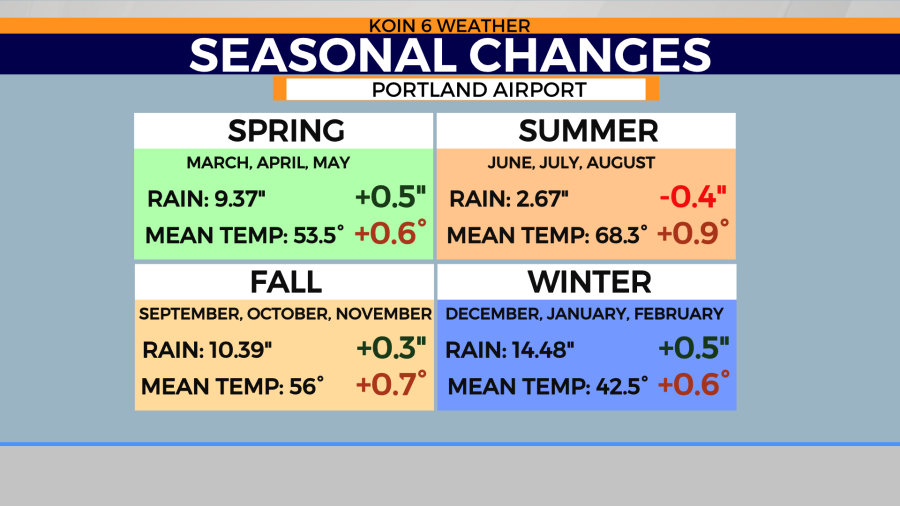
SPRING
The average rain came out to 9.37 inches, which was up 0.5 inches. Collectively, all three months saw an increase, but the most came from March (Figure 1 below). Unfortunately, this spring 2021, we have an average of 2.01 inches of rain through early May. We are very far from that new spring average of 9.37 inches. Temperatures also warmer, with a mean temperature for the spring coming in at 53.5 degrees. That is an increase of 0.6 degrees. The largest increase came from the month of May, where the monthly mean temperature change was 1.1 degrees (Figure 2). You will notice a common theme across the seasons, that we are warmer than the previous climate normals.
SUMMER
The average rain came out to 2.67 inches, which was down 0.4 inches. For such a dry collection of months, it’s not great to see those numbers go down. We know June can still bring in some decent rain, but the two months of July and August are typically real dry. Both months at least .10 inches drier than before. Temperatures also warmer, with a mean temperature coming in at 68.3 degrees. That is an increase of 0.9 degrees. Both July and August at least 1 degree warmer than previously (Figure 2). July 4 is usually cut off around the Pacific Northwest for true summer conditions. Is that hometown saying going to change? It may start being a Father’s Day and after is dry saying.
FALL
The average rain came out to 10.39 inches, which was up 0.5 inches. We did not have an agreement across all three months, in fact one month came in drier than the previous climate normals, that was November (Figure 1). October saw the largest gain out of all the months through out the full year. October saw a monthly rain change of 0.42 inches. That is pushing a half an inch! November dropped 0.18 inches from the previous 30 year round. Temperatures also warmer, with a mean temperature for the spring coming in at 56 degrees. That is an increase in 0.7 degrees. All three months warmer than before (Figure 2).
WINTER
The average rain came out to 14.48 inches, which was up 0.5 inches. Collectively, all three months saw an increase, but the most came from December (Figure 1). We know that the winter months is our time to bring in all the liquid precipitation that we can. After factoring in all of the seasons, we actually have an annual rain total of 36.91 inches which is up 0.88 inches from the 1981-2010 cycle. Temperatures, like all other months, are warmer. A mean temperature for the winter coming in at 42.5 degrees. That is an increase in 0.6 degrees. December saw an increase of 1.2 degrees. Does that warmer air mean more atmospheric rivers and a temperature increase? Typically atmospheric rivers bring warmer and wet weather. Something to think about it as we enter this new decade.

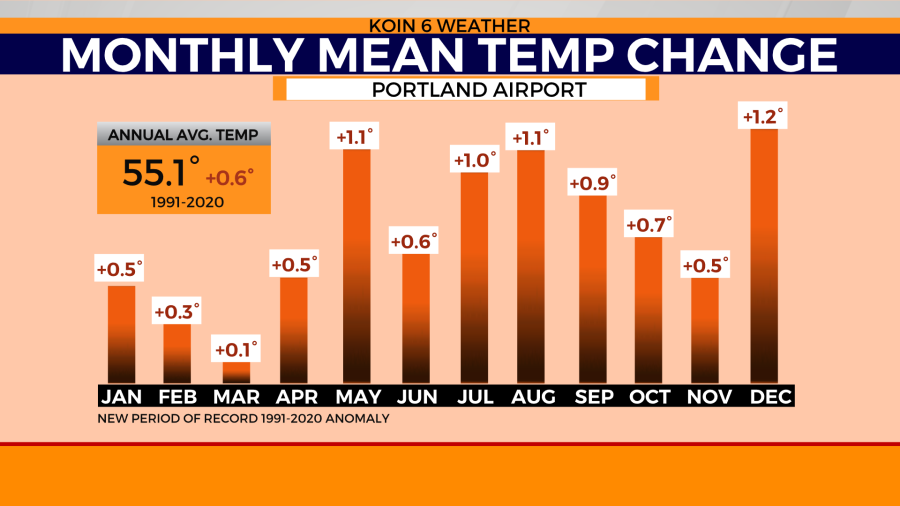
Again, if you look at figure 2 above, you can see that every month had an increase in temperature. March being the one month that had a much smaller increase than the others. The annual average temperature of 55.1 degrees finished 0.6 degrees warmer than the 1981-2010 cycle.
If you found this interesting, there are more articles in our climate corner section that you can visit here.