PORTLAND, Ore. (KOIN) – We have at least two more months of summer and that means we have plenty of our wildfire season still intact.
We have had double-digit wildfires already in Oregon and we actively have about 10 large wildfires around Oregon and Washington as of the second week of July. As wildfires become second nature to our weather broadcasts this summer, it is useful to understand some of the tools and language that we may use to help deliver the message to you at home. Wildfire season is extremely busy and our weather forecast may be geared around those conditions. We know just how intense wildfire season can be after a very threatening and dangerous season we had last year and quite frankly on and off for some time now. The information below will help shed some light on how wildfires and our weather forecast intertwine with each other.
WILDFIRE SIZE
You may hear or read a few terms about the size of wildfires as wildfire season unfolds through the summer. The two type of wildfire sizes that we typically refer to are “large” and “mega.” A large wildfire is at least 300 acres in size or greater. It becomes a megafire when the wildfire reaches 100,000 acres or more. 2020 had a large list of megafires in Oregon. You will recognize this list because these fires impacted the Willamette Valley and many local communities.

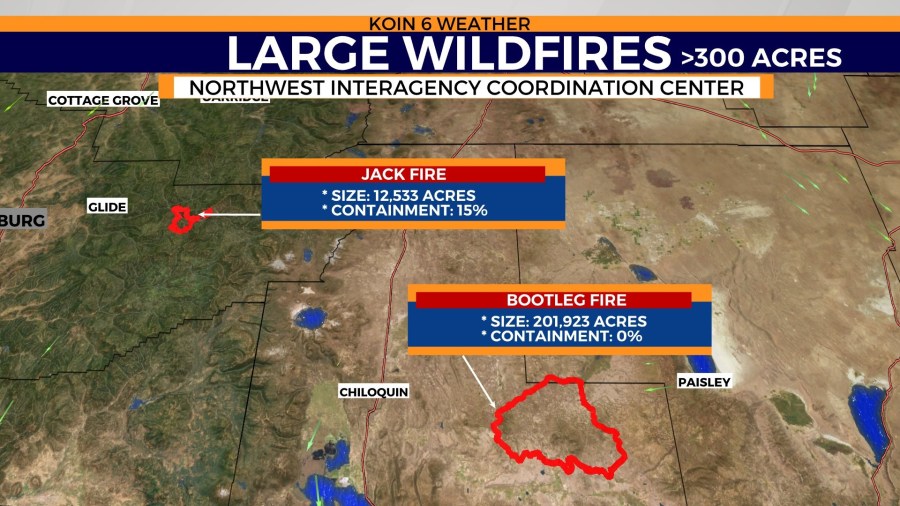
We currently have one megafire in Oregon (July 13, 2021), which is the Bootleg fire in Klamath and Lake counties. The graphic below also shows the Jack Fire which is considered a large fire, just to the northwest off of Highway 138. These are two examples of wildfire size and how the perimeter and size are referred to in acres in our weather broadcasts.
FUEL MOISTURE AND RELATIVE HUMIDITY
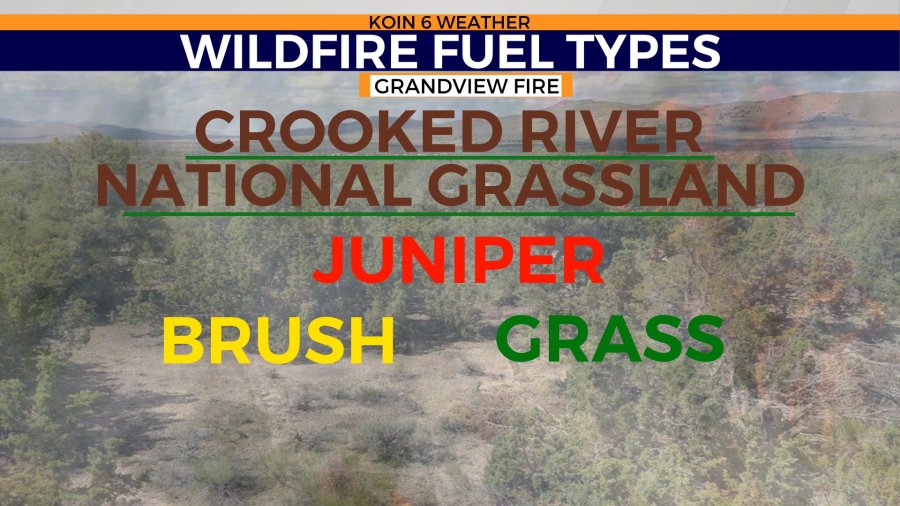
Dead fuel moisture is the amount of water in a piece of fuel. Dead fuels are dead vegetation is fallen logs, annual grasses that lose moisture, dead trees and floor debris. Dead fuels respond to the moisture content levels, absorbing water vapor from the air. It then also loses that water vapor due to evaporation. The fine fuels that are sitting on the ground will lose moisture quickly. Those thicker logs will take more time. Fuel levels are pivotal when gauging wildfires or potential danger in an area. When that moisture level is low, you know that the wildfires may spread quickly. Dead fuel isn’t a term that we tend to use during weather broadcasts, but it is worth understanding.
It is important because the fuel interacts with the relative humidity and temperature. This does take time depending on the fuel type and size.
HOW THE FORECAST AND ELEMENTS CONNECT
When the relative humidity is high, those dead fuels will absorb the moisture in a transaction that is favorable for preventing wildfires and rapid spread. However, when the relative humidity is very low, like during a red flag warning or fire weather warning, the air is now stripping the moisture from the fuels. As the temperature increases, the relative humidity decreases, which is the combination that occurs during the summer during the afternoon and evening hours. This is why we use relative humidity as a source for our weather broadcast when we are referring to wildfire conditions. Below you will see two graphics, one graphic depicting the use of relative humidity levels and the other a previous image of a red flag warning across Oregon and Washington. These are graphics you should be familiar with as wildfire season continues this summer. If you use some of the information above, you can deduce that the conditions in central Oregon are more worrisome based on the low relative humidity compared to the Oregon coast or Portland on July 12, 2021.
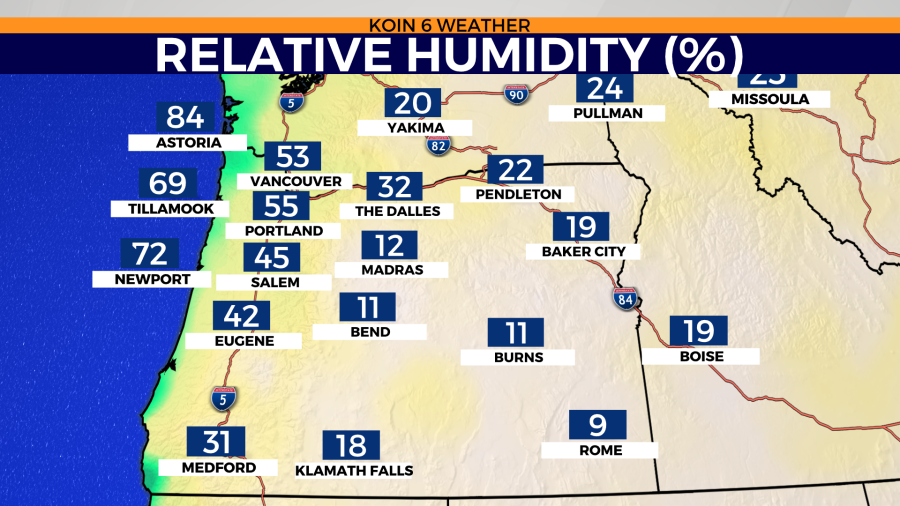
July 12, 2021 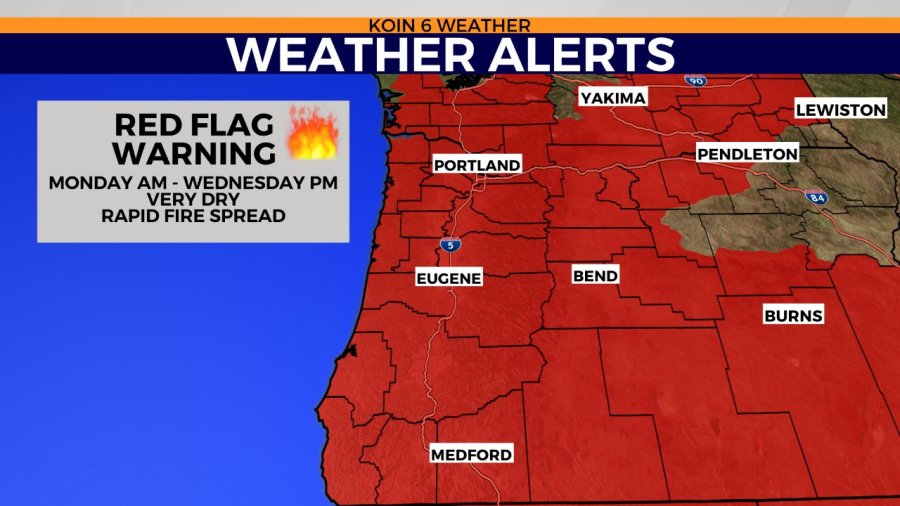
File Image Red Flag Warning
TOOLS IN THE WEATHER TOOLBOX
There are multiple tools that meteorologists will use when searching for new fires and also showing the growth of a wildfire. The main tool that is useful is satellite, which is extremely useful for spotting wildfire smoke. The satellite that we use to view the earth is about 22,000 miles away. Below is a video of the smoke plume and the pyrocumulus (clouds formed from the heat of a wildfire) clouds developing from the massive Bootleg Fire. You can even see the thin veil of smoke from the Jack Fire too. Obviously, with a tool from way above, you can pick up on the early stages of wildfires that may not be visual due to obstructions from the ground. You may not see a fire because there is something in the way. It’s a tool that also shows growth from a wildfire.
From time to time on social media, or during live events, you may see us use something called the fire temperature imagery. This is also satellite imagery that is set to pick out hot spots and smoke plumes. You can see how useful that tool is in the tweet below. Very important at night when the visible satellite is no longer of much use. It does exactly what you would expect, it makes the spots that are hotter more noticeable because they are emitting more radiation. We may use radar too, but satellite tends to be a more common tool during the wildfire season.
WIND, SMOKE, & AIR QUALITY
We know a little about the fuel types and the tools that are being used from the weather center, but we have to focus our attention on the parameters that are happening and going to happen at the surface of these wildfires. What is one element that is significant to impacting a wildfire? That is the wind!
We are currently monitoring the wind speed and wind forecast during the wildfire season. Weather models are vastly significant because they help determine short-scale and long-range behavior for wildland firefighters.
Fire meteorologists are integral when it comes to developing a plan and also helping fire agencies prepare. We also like to inform the viewer of the wind conditions and forecast to help you prepare. Just like any weather event that is harmful, our duty is to keep you informed.
The wind speed and forecast is going to be the element that you hear us refer to the most during our weather broadcast. We will discuss the wind gust forecast as a whole and we even break it down to location and hours in the day. The wind controls the narrative outside of the dry conditions. This is going to be the push to the wildfire and it is also the concern to the future forecast. A strong wind is dangerous and it will impact wildfires and the conditions in erratic ways.
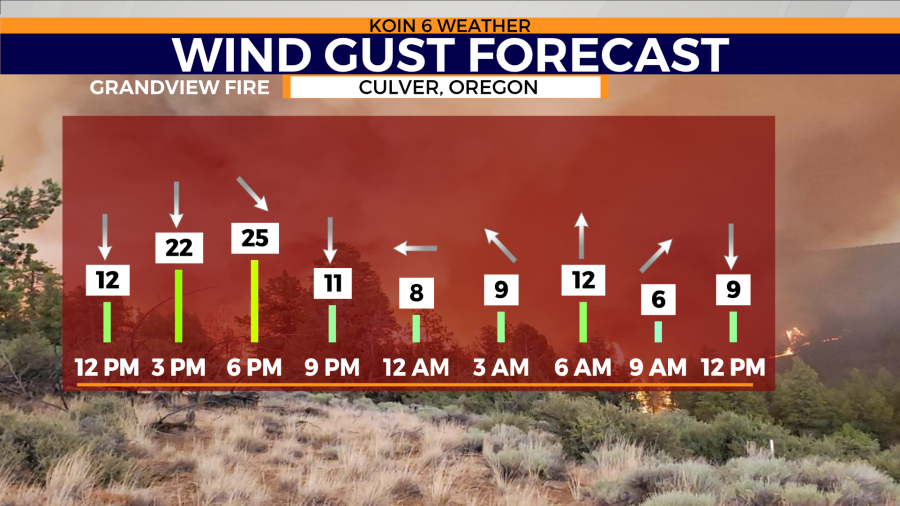
Wind Gust Model 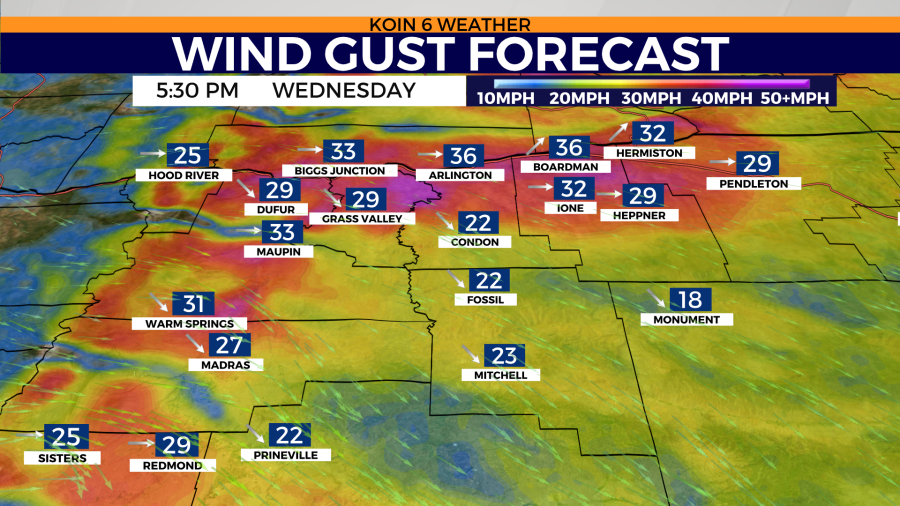
Wind Gust Model Variety 2
This video from the Washington State Department of Natural Resources helps guide the importance of following the wind forecast and how wind can truly create more harm. Take a second to watch the video, as it describes the wind and how it carries embers from wildfires out miles, which may then create more fire.
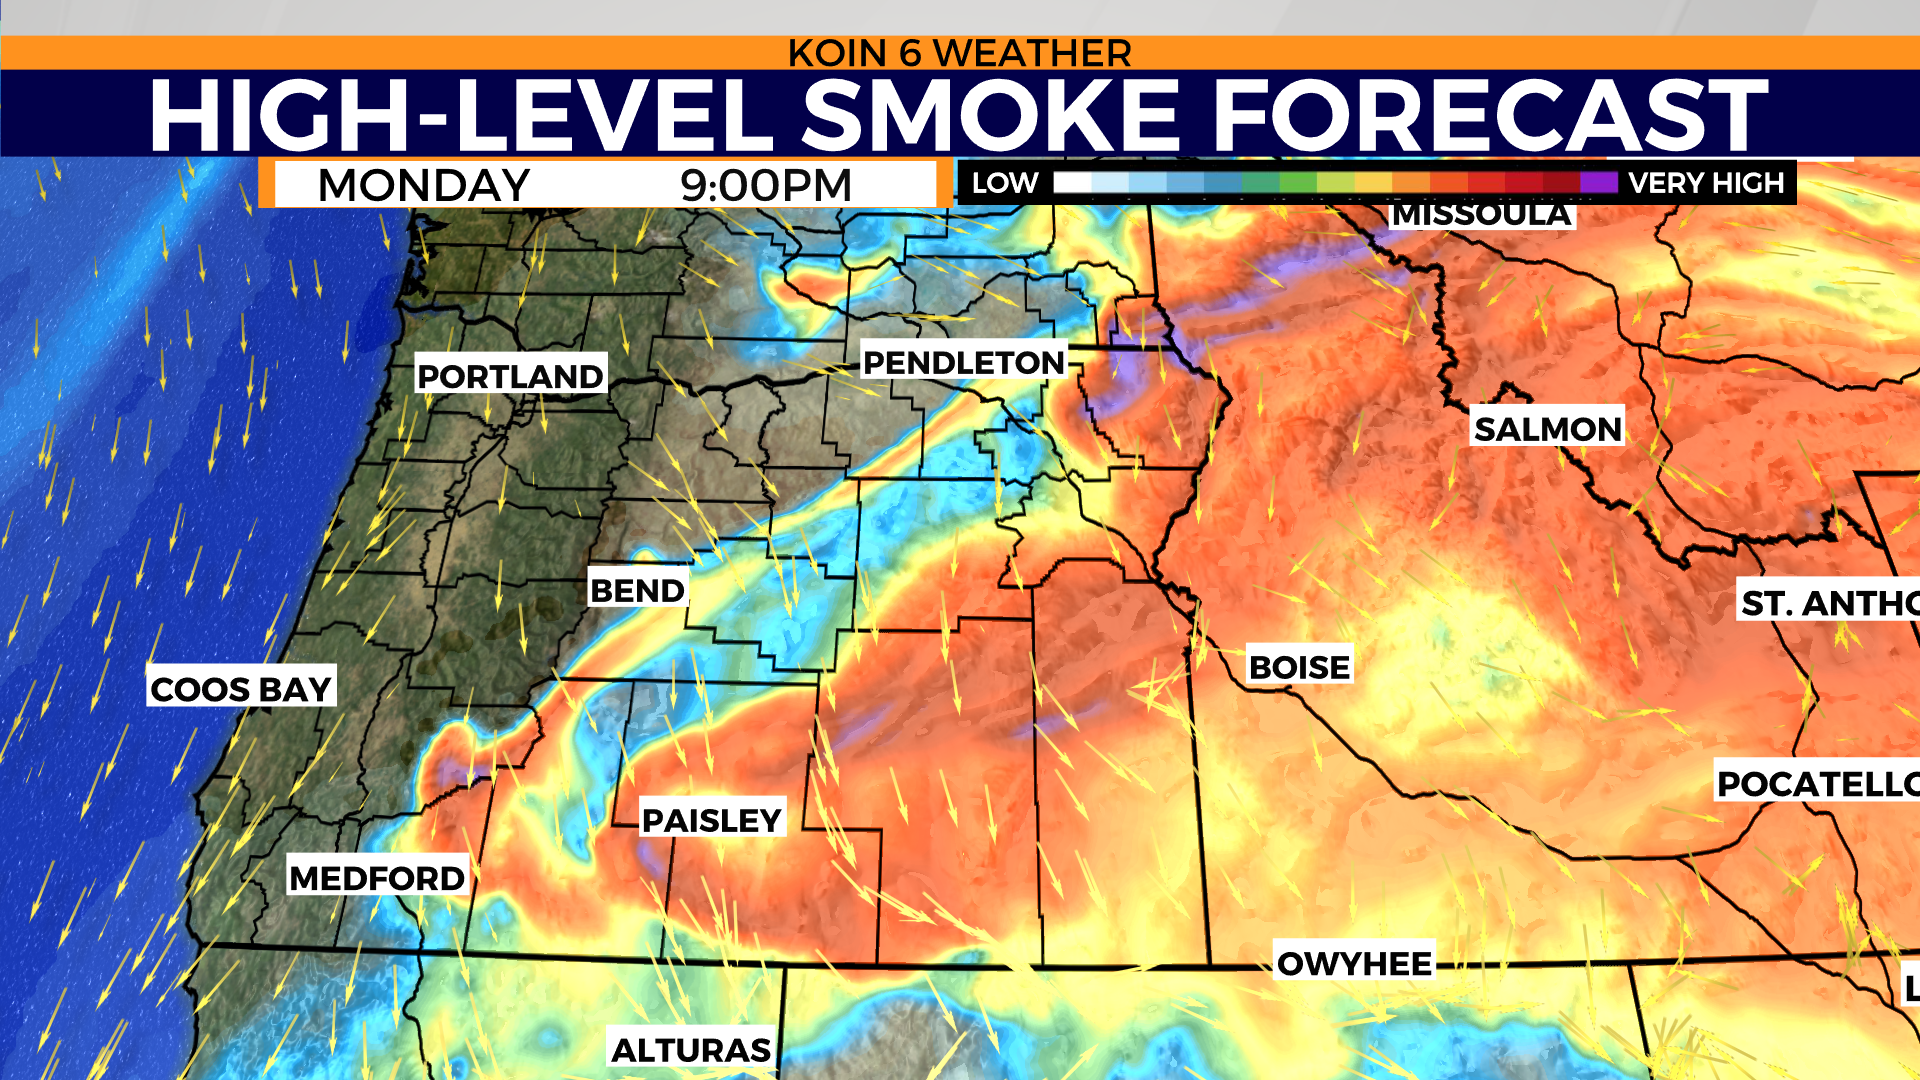
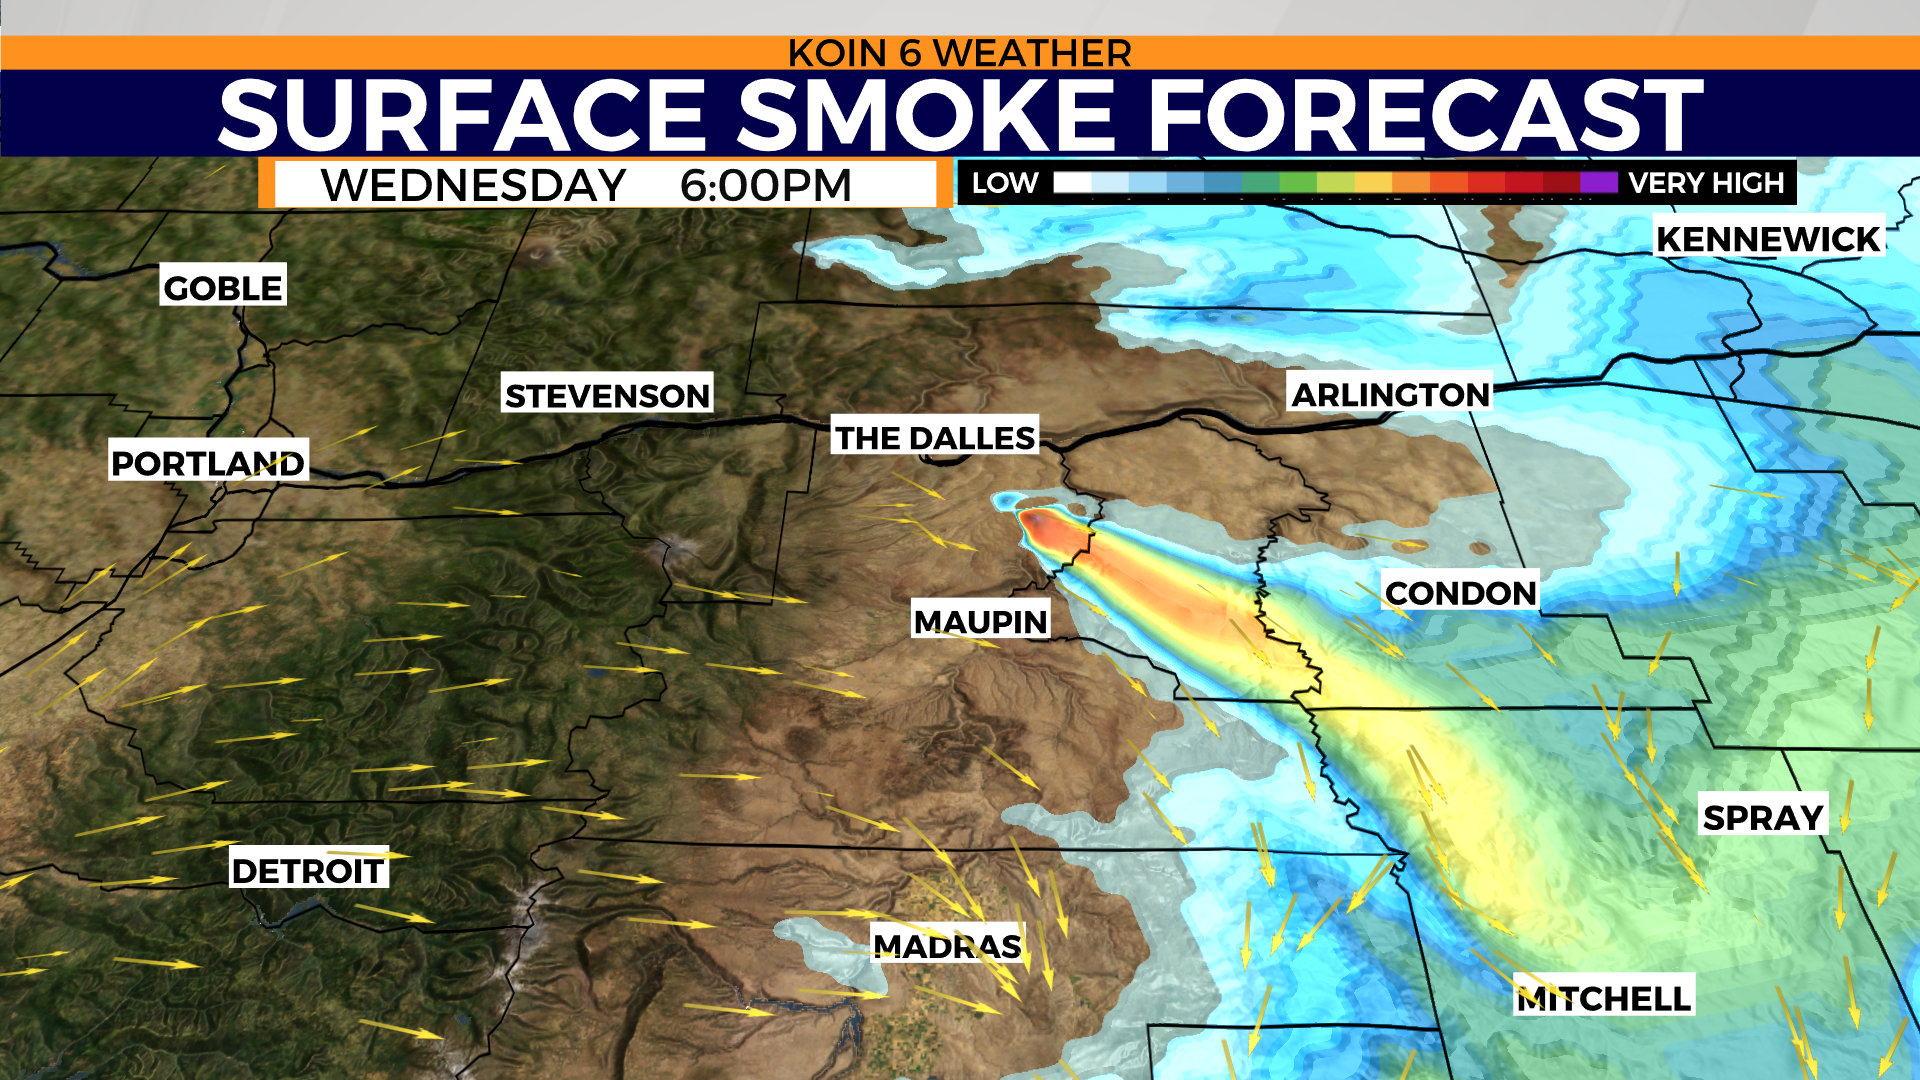
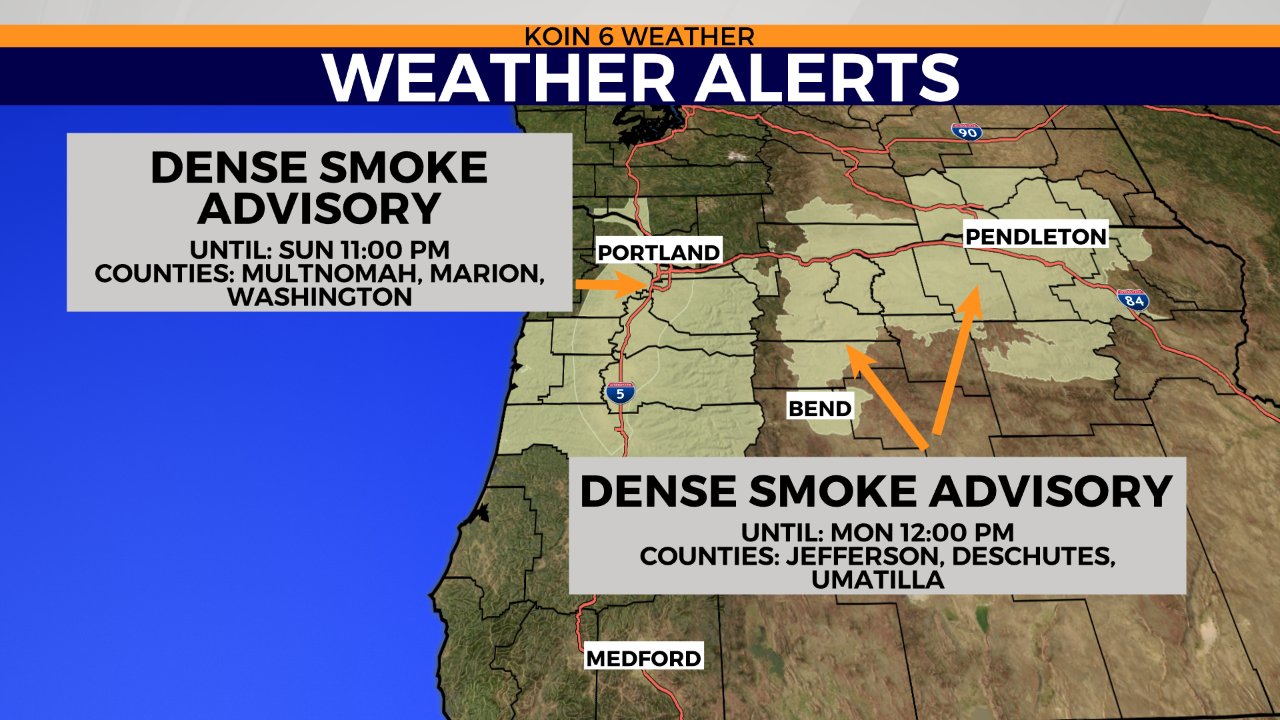
Wind also controls the direction of the wildfire smoke. Watching the wind pattern at the surface and up through the atmosphere is pivotal for the smoke forecast. We use both a surface and high-level smoke forecast. The surface smoke forecast tends to tell the story close to our local wildfires and the direct impact to nearby communities. The high-level smoke forecast will show the general pattern and how it may impact areas outside of Oregon and the Pacific Northwest (PNW). The smoke models that we use are also very good at pinpointing the areas that will have light or heavy smoke. How much will the smoke impact a certain region? We know exactly what it feels like to live under a layer of wildfire smoke. It changes the dynamics of your life dramatically. In the thick of our wildfires last year, we even had dense smoke advisories. This will impact the local forecast, especially the temperature for the day.


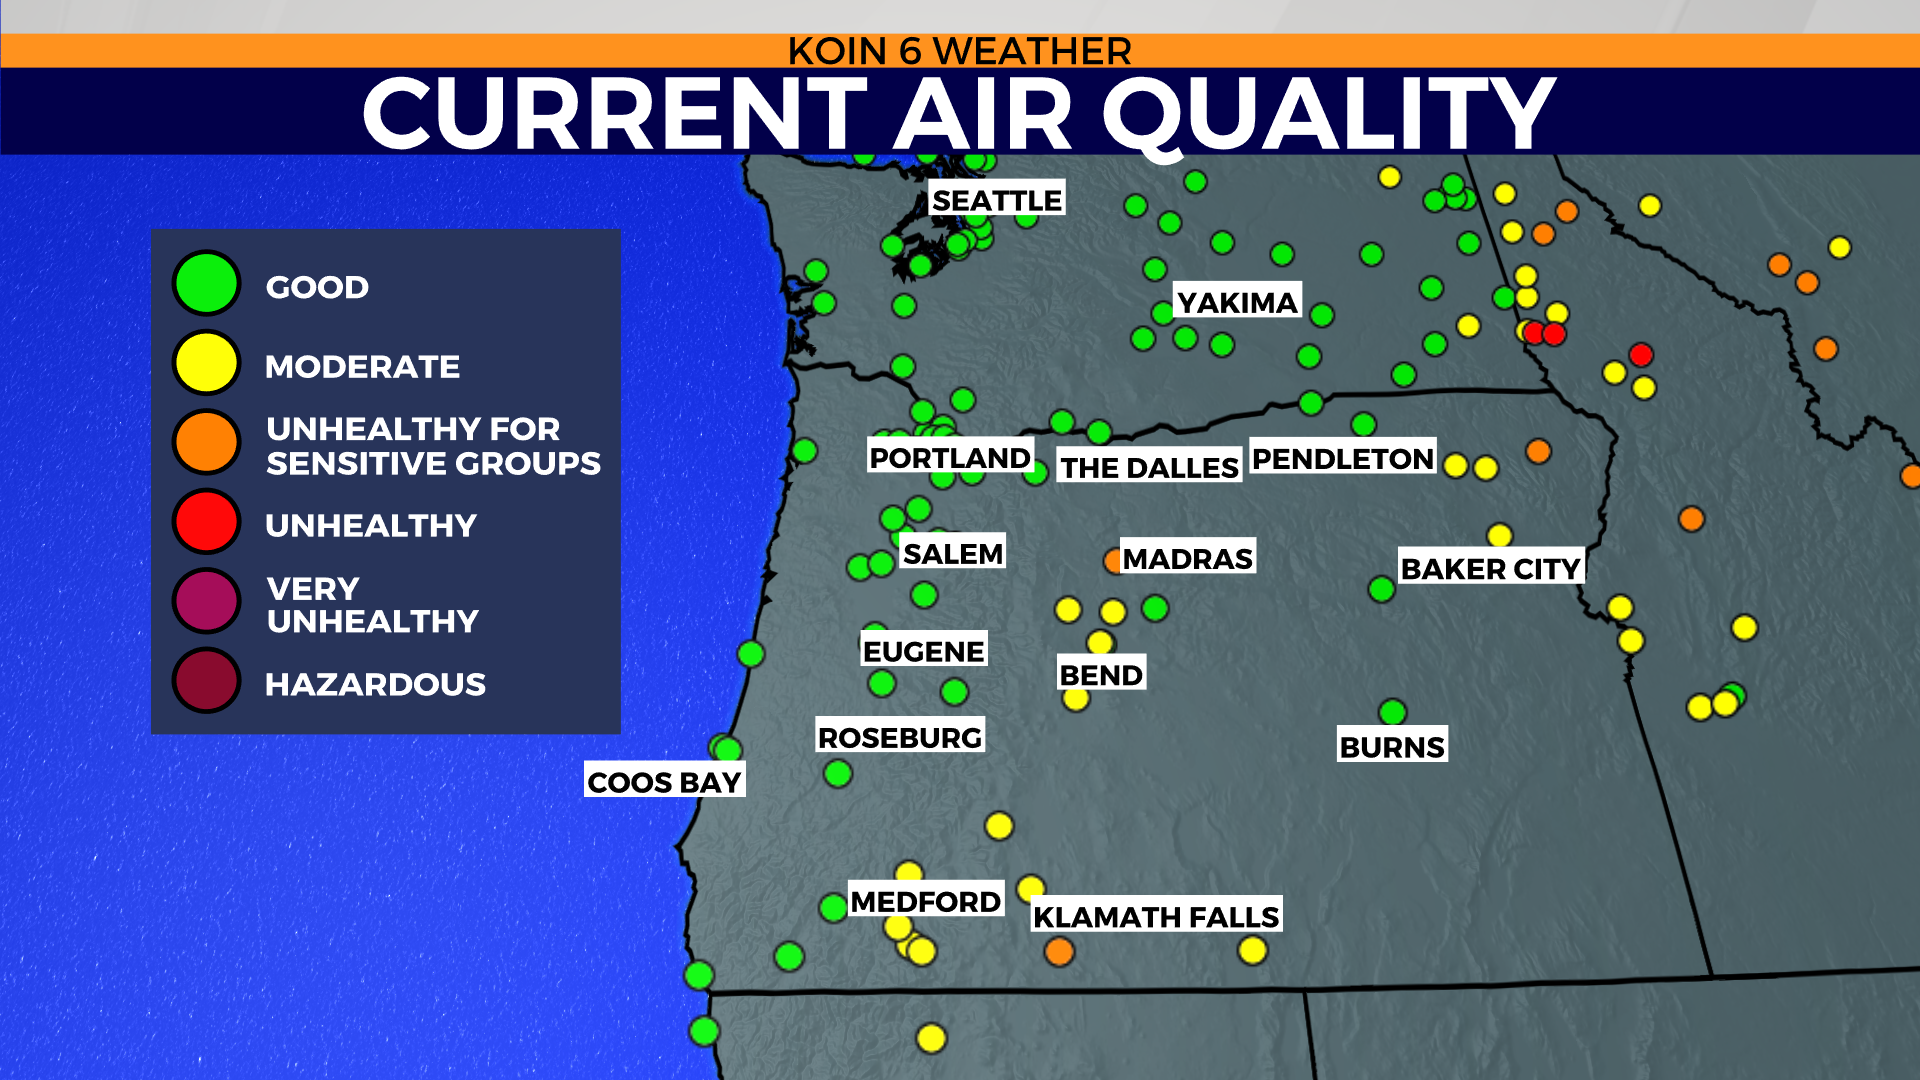
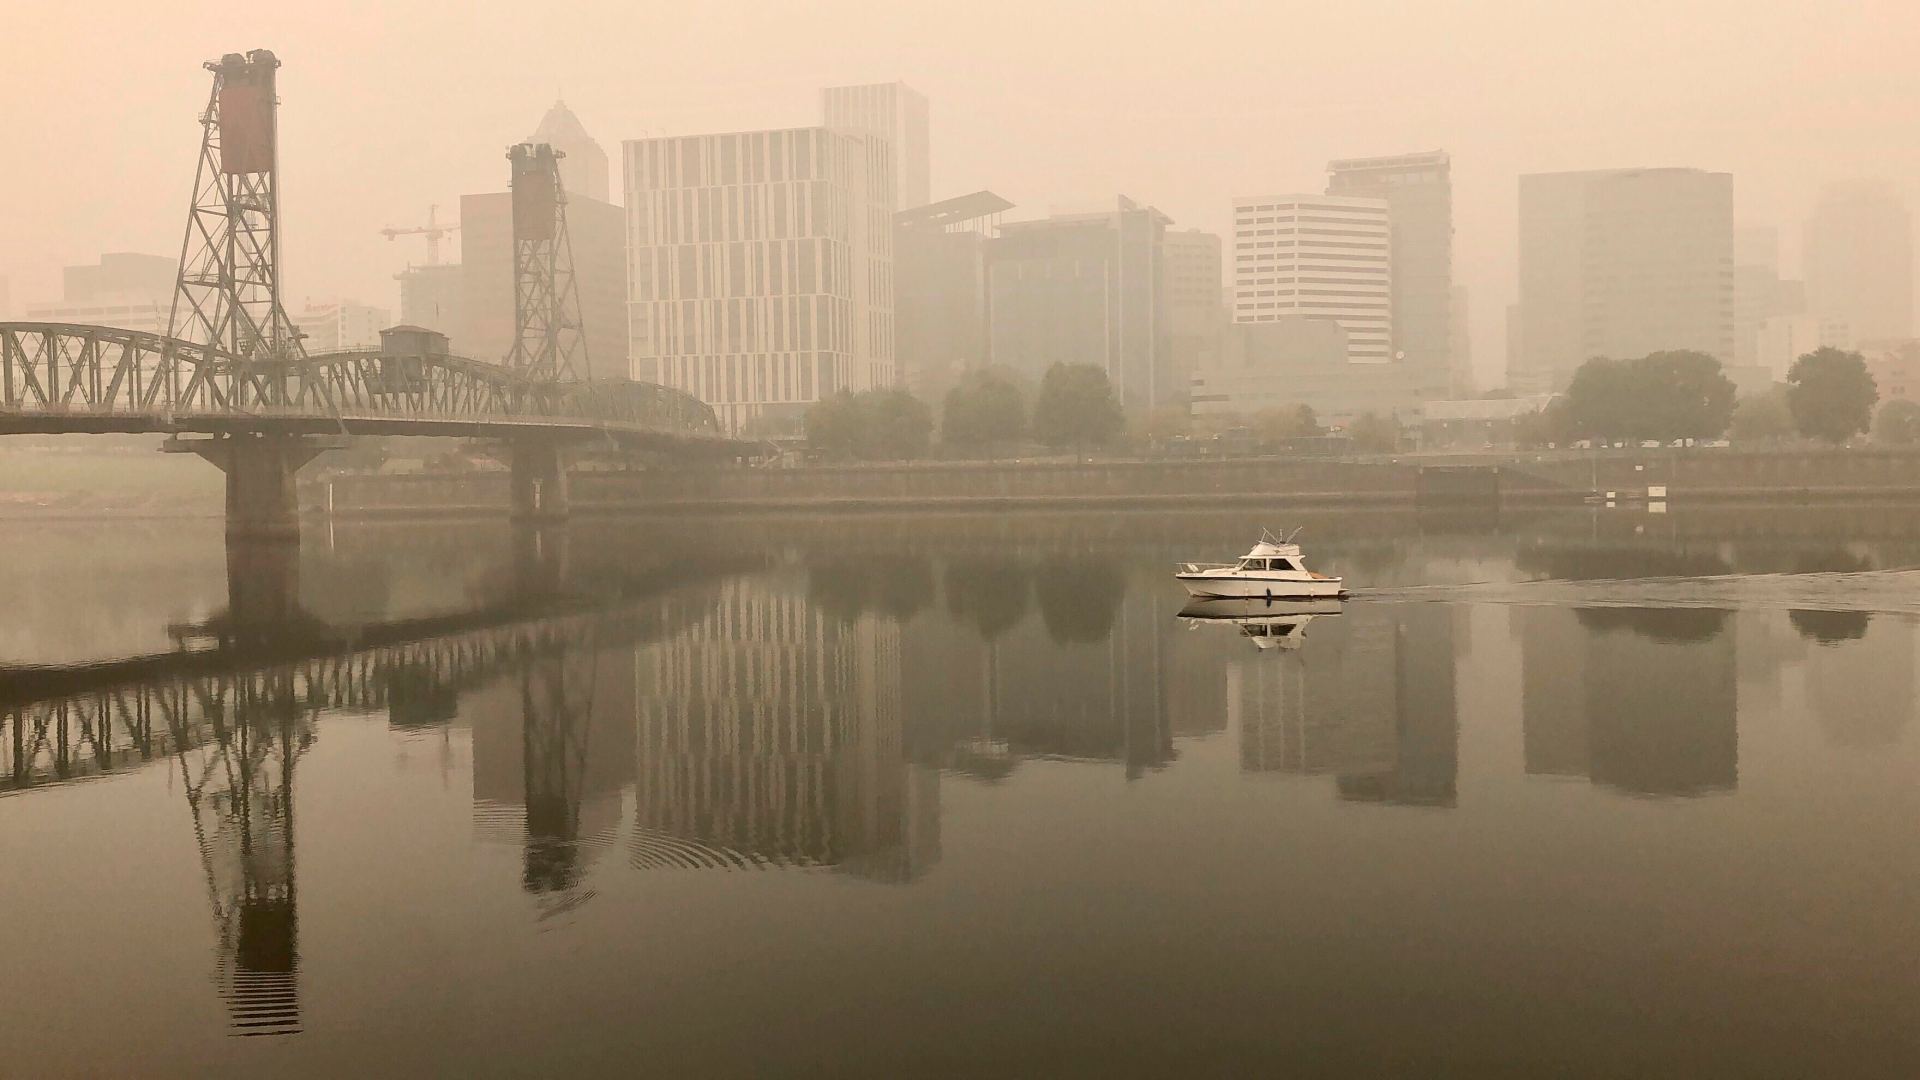
Ultimately, this will all lead to the air quality in your region. Wildfires produce smoke which then reduces the air quality reading for your neighborhood. Everything is tied together when we are looking at the wildfire forecast. Use the slideshow below to cycle through some of the graphics that we use to show the ups and downs of the air quality during a wildfire event. The final image is of downtown Portland back on Monday, September 14, 2020, when the wildfire smoke dropped our air quality significantly. In extreme situations, the air quality may even reach hazardous levels.