
PORTLAND, Ore. (KOIN) — An analysis of the City of Portland’s 68 proposed Safe Rest Village sites, which officials say will be used to select just six for development, shows fewer sites are proposed in higher income bracket neighborhoods than in lower income bracket neighborhoods. That being said, previously released data by the city shows that many poorer neighborhoods have a higher density of potential city-owned sites that would be considered viable, according to standards set by the city, than higher-income neighborhoods do.
KOIN 6 News took the time to break down each proposed Safe Rest Village site by neighborhood, along with the estimated median household income of each neighborhood, with the help of Portland State University’s Center for Spatial Analysis and Research, following concerns from some East Portland residents that the poorer neighborhoods were carrying the brunt of the proposed sites.
Last month, the City of Portland released its list of 68 proposed Safe Rest Village sites for people experiencing homelessness as part of an effort to address the housing crisis in the city. They would be outdoor shelters, but not tents. Officials plan to narrow that list down to just six and construct them before the end of the year. It’s unclear when the six finalized sites will be announced by the city.
Below is a map KOIN 6 News created that lists the 68 proposed homeless village sites of the city overlaid onto a Portland neighborhood boundary map. Bear in mind that in some instances, clusters of markers are representative of one proposed site which spans multiple parcels of land owned by the city. For instance, the Columbia Buffer Strip area located near 3043 N Trenton St. spans over 35 land parcels, according to the city’s own Safe Rest Village proposal list:
For comparison, below is a map provided by David Banis, Associate Director for PSU’s Center for Spatial Analysis and Research. Banis said the median household income data, broken down by neighborhood, is derived from averages from the U.S. Census Bureau’s American Community Survey from 2015-2019, which may have a margin of error of about 10%. And to calculate the MHI to be neighborhood-specific, converted from census tracts, that margin of error may be even greater. He said we’ll get more accurate MHI data after more of the 2020 Census data gets released and analyzed. Until then, these estimates are most useful for comparison purposes, Banis said, for instance determining which neighborhoods have the highest vs. lowest income percentages compared to the citywide average:

The number of neighborhoods in each income bracket is fairly evenly split, with roughly 18-20 neighborhoods in each level in Portland. Yet the number of proposed shelter sites, broken down per income bracket, does appear to become fewer and fewer the higher the income level (see below):
- Neighborhoods with a MHI of ≤ $60,540 have 30.9% of total proposed shelter sites
- Neighborhoods with a MHI of ≤ $71,504 have 25% of total proposed shelter sites
- Neighborhoods with a MHI of ≤ $87,188 have 20.6% of total proposed shelter sites
- Neighborhoods with a MHI of ≤ $109,021 have 17.6% of total proposed shelter sites
- Neighborhoods with a MHI of ≤ $165,975 have 2.9% of total proposed shelter sites
- 2.9% of total proposed shelter sites were located in neighborhoods where income data was not applicable and/or not available (this includes unclaimed Multnomah County at Lake Yard).
Back in January, a Bureau of Planning and Sustainability memo was submitted to the volunteer citizen Planning and Sustainability Commission with four maps, one of which laid out “Potential Outdoor Shelter Sites by Neighborhood Allowed Under Clear and Objective Standards.” The map showed some neighborhoods have a larger amount of potential sites located within them than others.
The accompanying Jan. 22 memo stated that “Although availability is not equally distributed throughout the City, every neighborhood has at least some sites available for an outdoor shelter.”
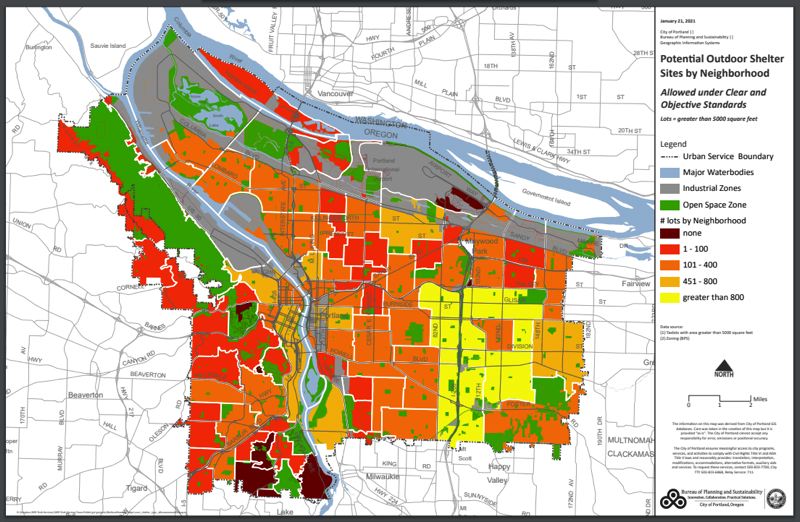
Although the number of proposed homeless sites becomes fewer and fewer as you go higher up on the income scale, it does also appear, based on the map above, that lower-income neighborhoods generally also have a higher-density of potential shelter sites that would be allowed by the city:
- No Potential Outdoor Shelter Sites Allowed Under Clear and Objective Standards
- 50% of the neighborhoods under this category have an MHI of ≤ $165,975
- 25% of the neighborhoods under this category have an MHI of ≤ $109,021
- 25% of the neighborhoods under this category have an MHI of ≤ $60,540
- 1-100 Potential Outdoor Shelter Sites Allowed Under Clear and Objective Standards
- 41.7% of neighborhoods under this category have an MHI of ≤ $165,975
- 25% of neighborhoods under this category have an MHI of ≤ $109,021
- 16.7% of neighborhoods under this category have an MHI of ≤ $87,188
- 8.3% of neighborhoods under this category have an MHI of ≤ $71,504
- 8.3% of neighborhoods under this category have an MGI of ≤ $60,540
- 101-400 Potential Outdoor Shelter Sites Allowed Under Clear and Objective Standards
- 17.5% of neighborhoods under this category have an MHI of ≤ $109,021
- 27.5% of neighborhoods under this category have an MHI of ≤ $87,188
- 35% of neighborhoods under this category have an MHI of ≤ $71,504
- 20% of neighborhoods under this category have an MHI of ≤ $60,540
- 451-800 Potential Outdoor Shelter Sites Allowed Under Clear and Objective Standards
- 12.5% of neighborhoods under this category have an MHI of ≤ $109,021
- 25% of neighborhoods under this category have an MHI of ≤ $87,188
- 12.5% of neighborhoods under this category have an MHI of ≤ $71,504
- 50% of neighborhoods under this category have an MHI of ≤ $60,540
Below is a list of Portland Neighborhoods, the number of Safe Rest Village sites proposed for each, the estimated median household income for each neighborhood and the total potential outdoor shelter sites allowed under the city’s Clear and Objective Standards for each neighborhood.
| Neighborhood | Shelter Sites Proposed | Median Household Income/year (est.) | Potential Outdoor Shelter Sites by Neighborhood allowed under Clear and Objective Standards |
| Alameda | 0 | ≤ $165,975 | 1-100 |
| Arbor Lodge | 0 | ≤ $87,188 | 101-400 |
| Ardenwald/Johnson Creek | 0 | ≤ $165,975 | 1-100 |
| Argay Terrace | 0 | ≤ $60,540 | 1-100 |
| Arlington Heights | 0 | ≤ $165,975 | None |
| Arnold Creek | 0 | ≤ $165,975 | None |
| Ashcreek | 0 | ≤ $109,021 | 1-100 |
| Beaumont-Wilshire | 0 | ≤ $165,975 | 1-100 |
| Boise | 0 | ≤ $87,188 | 101-400 |
| Brentwood/Darlington | 0 | ≤ $71,504 | 101-400 |
| Bridgeton | 0 | ≤ $87,188 | 1-100 |
| Bridlemile | 0 | ≤ $165,975 | 1-100 |
| Brooklyn | 0 | ≤ $87,188 | 1-100 |
| Buckman | 0 | ≤ $60,540 | 451-800 |
| Cathedral Park | 3 | ≤ $87,188 | 101-400 |
| Centennial | 1 | ≤ $60,540 | 451-800 |
| Collins View | 1 | ≤ $165,975 | 1-100 |
| Concordia | 0 | ≤ $109,021 | 101-400 |
| Creston-Kenilworth | 0 | ≤ $71,504 | 101-400 |
| Crestwood | 1 | ≤ $109,021 | 1-100 |
| Cully | 0 | ≤ $60,540 | 451-800 |
| Downtown | 0 | ≤ $60,540 | 451-800 |
| East Columbia | 1 | ≤ $87,188 | 1-100 |
| Eastmoreland | 0 | ≤ $165,975 | 1-100 |
| Eliot | 8 | ≤ $71,504 | 451-800 |
| Far Southwest | 1 | ≤ $87,188 | 1-100 |
| Forest Park | 0 | ≤ $165,975 | 1-100 |
| Foster-Powell | 0 | ≤ $71,504 | 101-400 |
| Glenfair | 0 | ≤ $60,540 | 101-400 |
| Goosehollow Foothills League | 2 | ≤ $71,504 | 101-400 |
| Grant Park | 0 | ≤ $165,975 | 1-100 |
| Hayden Island | 1 | ≤ $109,021 | 1-100 |
| Hayhurst | 0 | ≤ $109,021 | 101-400 |
| Hazelwood | 2 | ≤ $60,540 | Greater than 800 |
| Healy Heights | 0 | ≤ $109,021 | None |
| Hillsdale | 1 | ≤ $109,021 | 101-400 |
| Hillside | 0 | ≤ $165,975 | 1-100 |
| Hollywood | 0 | ≤ $71,504 | 101-400 |
| Homestead | 0 | ≤ $109,021 | 1-100 |
| Hosford-Abernethy | 0 | ≤ $87,188 | 1-100 |
| Humboldt | 1 | ≤ $87,188 | 101-400 |
| Irvington | 0 | ≤ $109,021 | 101-400 |
| Kenton | 4 | ≤ $87,188 | Open Space Zone (# of lots not listed) |
| Kerns | 2 | ≤ $60,540 | 101-400 |
| King | 0 | ≤ $71,504 | 101-400 |
| Laurelhurst | 0 | ≤ $165,975 | 1-100 |
| Lents | 2 | ≤ $60,540 | Greater than 800 |
| Linnton | 0 | ≤ $109,021 | 1-100 |
| Lloyd District | 4 | ≤ $60,540 | 101-400 |
| Madison South | 1 | ≤ $60,540 | 101-400 |
| Maplewood | 0 | ≤ $109,021 | 1-100 |
| Markham | 0 | ≤ $165,975 | 1-100 |
| Marshall Park | 1 | ≤ $165,975 | None (Open Space Zone listed) |
| MC Unclaimed #14 (Lake Yard) | 2 | Unavailable | Industrial Zone (# of lots not listed) |
| Mill Park | 2 | ≤ $60,540 | 101-400 |
| Montavilla | 0 | ≤ $71,504 | Greater than 800 |
| Mt Scott-Arleta | 0 | ≤ $71,504 | 101-400 |
| Mt Tabor | 1 | ≤ $87,188 | 101-400 |
| Multnomah | 0 | ≤ $87,188 | 101-400 |
| North Tabor | 0 | ≤ $71,504 | 101-400 |
| Northwest | 0 | ≤ $87,188 | 451-800 |
| Northwest Heights | 0 | ≤ $165,975 | 1-100 |
| Old Town | 2 | ≤ $60,540 | 101-400 |
| Overlook | 5 | ≤ $109,021 | 101-400 |
| Parkrose Heights | 0 | ≤ $71,504 | 101-400 |
| Parkrose | 1 | ≤ $60,540 | 101-400 |
| Pearl | 0 | ≤ $60,540 | 101-400 |
| Piedmont | 1 | ≤ $71,504 | 101-400 |
| Pleasant Valley | 1 | ≤ $87,188 | 101-400 |
| Portsmouth | 0 | ≤ $71,504 | 101-400 |
| Powellhurst-Gilbert | 3 | ≤ $60,540 | Greater than 800 |
| Reed | 0 | ≤ $71,504 | 1-100 |
| Richmond | 0 | ≤ $87,188 | 101-400 |
| Rose City Park | 0 | ≤ $109,021 | 101-400 |
| Roseway | 0 | ≤ $87,188 | 1-100 |
| Russell | 0 | ≤ $71,504 | 1-100 |
| Sabin | 0 | ≤ $109,021 | 1-100 |
| Sellwood-Moreland | 1 | ≤ $87,188 | 451-800 |
| South Burlingame | 0 | ≤ $165,975 | 1-100 |
| South Portland | 4 | ≤ $109,021 | 451-800 |
| South Tabor | 0 | ≤ $71,504 | 101-400 |
| Southwest Hills Residential League | 0 | ≤ $165,975 | 1-100 |
| St Johns | 6 | ≤ $71,504 | 101-400 |
| Sullivan’s Gulch | 0 | ≤ $71,504 | 1-100 |
| Sumner | 0 | ≤ $60,540 | 1-100 |
| Sunderland | 1 | ≤ $60,540 | 1-100 |
| Sunnyside | 0 | ≤ $87,188 | 101-400 |
| Sylvan-Highlands | 0 | ≤ $165,975 | 1-100 |
| University Park | 1 | ≤ $87,188 | 101-400 |
| Vernon | 0 | ≤ $109,021 | 1-100 |
| West Portland Park | 0 | ≤ $87,188 | 101-400 |
| Wilkes | 0 | ≤ $71,504 | 101-400 |
| Woodland Park | 0 | ≤ $60,540 | None |
| Woodlawn | 0 | ≤ $109,021 | 1-100 |
| Woodstock | 0 | ≤ $109,021 | 101-400 |
For a related story about Hazelwood Neighborhood Association’s dissatisfaction about the distribution of the proposed Safe Rest Village sites throughout the city, check here.