PORTLAND, Ore. (KOIN) – Just as the rain starts to show up in the forecast, the water year, which is from Oct. 1, 2020 to Sept. 30, 2021, is coming to an end.
The water year is going to finish below the average for what looks to be the fourth water year in a row. The last time we had anything near or above average, was the 2016-2017 water year. That was a gully washer of a year, with a soaking winter rain that kept on giving. The same goes for 2015-2016 when we had the wettest December on record.
We know which months out of the year can really bring in the water, but it’s the fringe months that make a large difference around here. You know how the saying goes, the whole is greater than the sum of the parts. We need a little rain each month to help us stay on the right path.
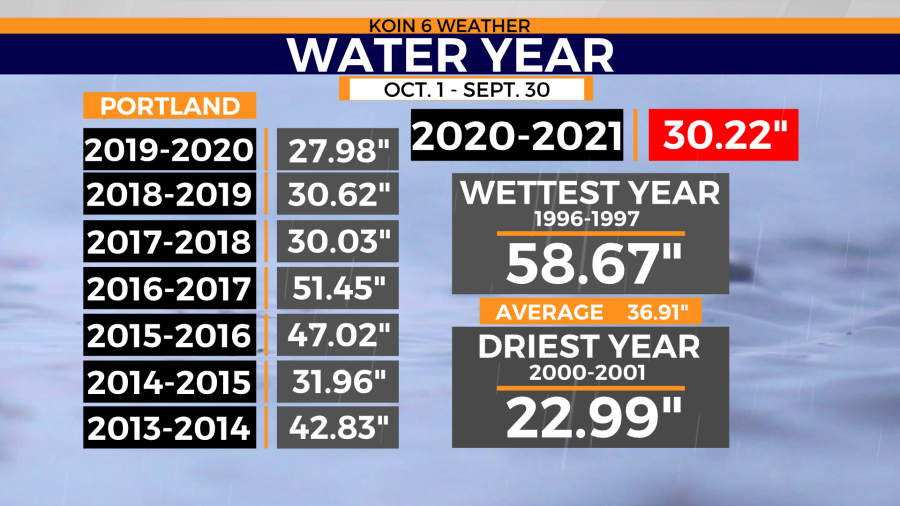
For now, we broke 30 inches in Portland this year. It’s far from the wettest year on record, which comes in at a whopping 58.67 inches. Thankfully, it isn’t close to the driest year on record, which happened to be set in 2000-2001, with 22.99 inches of rain.
Unfortunately, we’ve been closer to the driest year than the wettest year recently. You can see the list of the previous eight water year totals in the graphic below.
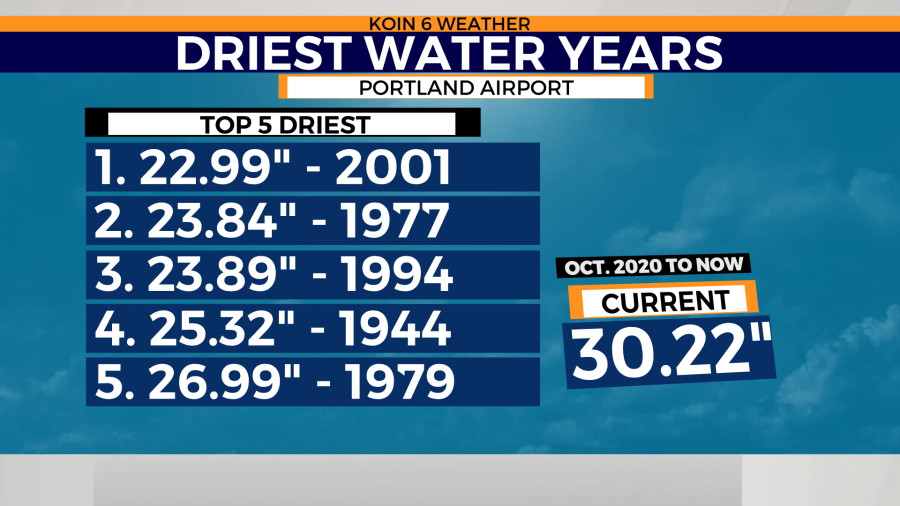
There is a top-five list of the driest water years on record, and four of the top five happen to be outside the 21st century. We were close to hitting the top five in 2019-2020, but we made it just outside of that negative feat.
We need to keep in mind that although we haven’t made it onto the list, we have had four years in a row of well below-average years. We’re coming out to roughly 24 inches below the four-year period. That can really mess with the drought conditions over time.
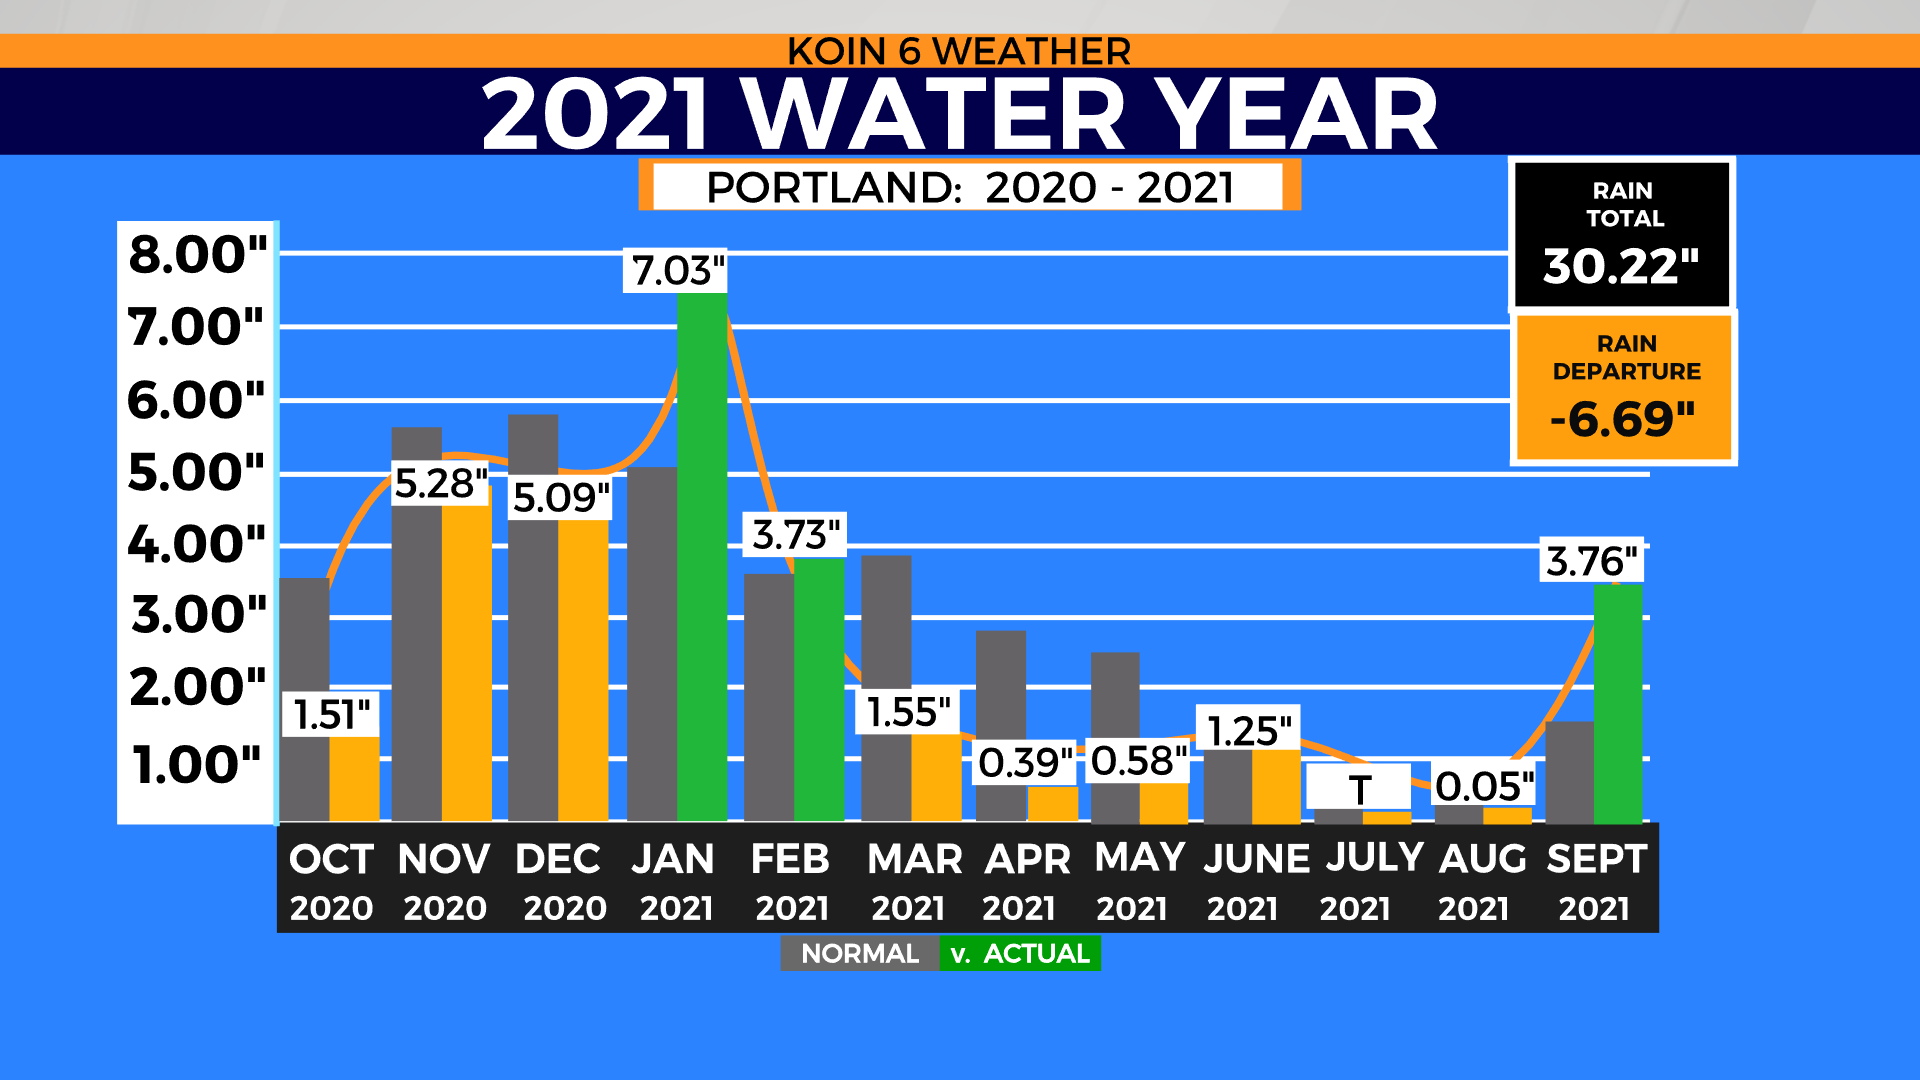
Why don’t we take a look at what we have going on this water year? There have only been three months this water year where we had above average rain: January, February, and September. The most difficult stretch this year happened from March to August. This is when rain totals fell below average for six straight months.
The combination of that stretch of time was one of the driest spring and summer combinations on record. We had a total of 3.82 inches from the start of March through the month of August, which was 8.22 inches shy of the average for that collection of time. That didn’t set us up for success this year, but instead, helped build the drought conditions in Oregon and Washington. There were six months that didn’t even reach half of the average monthly rain total: October, March, April, May, July and August.
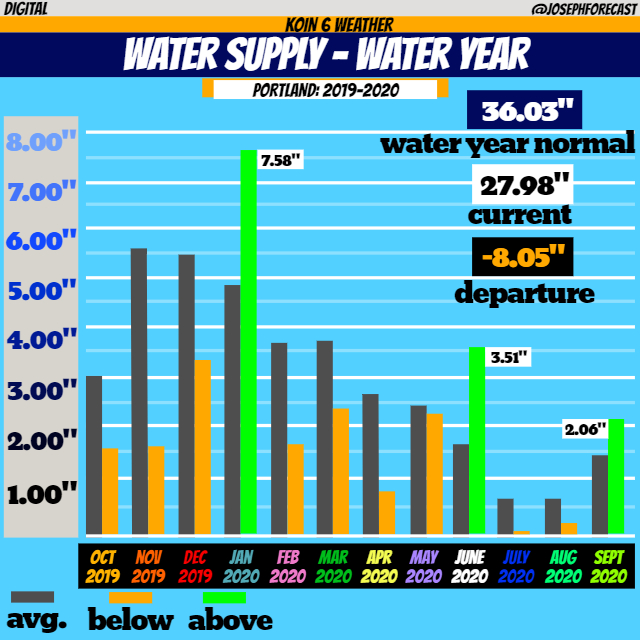
The slideshow also has the water year graphic from 2019-2020. After all the dull news about our drought this year, you may think it was worst than last. We actually have had more total water this water year, but it was the historically dry spring and summer that put us well into the hole.
What has been beneficial recently is the spike in our rain this September. We’ve been very fortunate west of the Cascades this September. We have brought in well over our average rain total for the month and that rain brought in a helping hand to wildfires around the Cascades. Of course, the end of the water year doesn’t mark the end of the wildfire season.
This map really tells the story of where the rain has shown up over the tail end of the season and where it has been nonexistent. Below we have the seasonal precipitation vs the current month precipitation. Check out how much of Oregon struck gold this month when it comes to water. Most sections came out in the dark blue, which is a color we should cheer for at this time. Those that fell in that category are above 130 percent for the current monthly precipitation. Talk about being fortunate.
Whether we fall short for the season or we find a surplus of water, there is one thing we do like to do: finish the water year on a positive note.

