PORTLAND, Ore. (KOIN) — When you watch our weather broadcasts here at KOIN 6, you will hear us mention our normal precipitation totals for a month or maybe the normal high temperature for the day. That information has to come from somewhere!
Well, this article will break that down and it also is going to explore the new climate normals that were delivered to the public this week. Has it felt like the summer has been drier the last 10 years? Do you feel like the temperature has been warmer? Let’s take a look!
If you’re curious, our normal high for May 4 was 65 degrees when calculating the years between 1981 to 2010, but now with the new climate normal update, it is 66.8 degrees. Those official normals are calculated over a 30 year period. Every 10 years, it is updated. This is all done through NOAA’s National Centers for Environmental Information (NCEI). We have been working with a 1981-2010 climate normal period until now. With a new decade, NCEI can shift that 30 year period to 1991-2020.
Why this is important?
This helps forecasters and the generally the public understand the context of our weather for the day. It goes beyond that though, it is used for businesses, organizations, education and studies. This goes back to the 1950s when we started the operation here in the United States as a way to stay consistent with the World Meteorological Organization (WMO).
Breaking down the data
We will pick out a few pieces to discuss in this article as they related to the Pacific Northwest (PNW) and Portland.
Why don’t we start with an overview of the annual mean temperature and precipitation change from 1991-2020 minus that of 1981-2010. You will have to use the slideshow below to see both images that have been offered. There is no surprise that the annual mean temperature change is generally warmer for most in the United States. This includes Oregon and just about most locations in Washington (outside of a small light blue area around Chehalis). Have you lived in the region through this period of time? Have you noticed this?
How about the annual precipitation change? The southwest has found itself drier, but there are many locations that are coming in wetter. If we focus in on Oregon, we have some locations in central Oregon that are much drier in this new bracket than the previous 30 year period. There are some light shades of green around the Oregon coast and over in the mountain range of northeast Oregon. It appears that portions of Washington are coming in wetter too. As an overview, it is the high desert of Oregon that continues to be dry.
Noticeable adjustments (July & October)
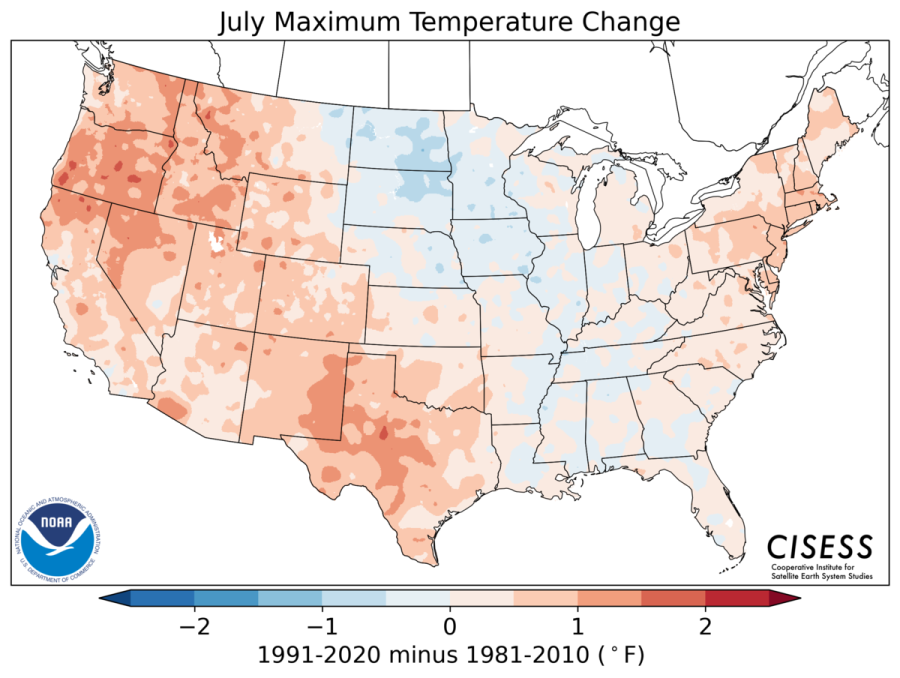
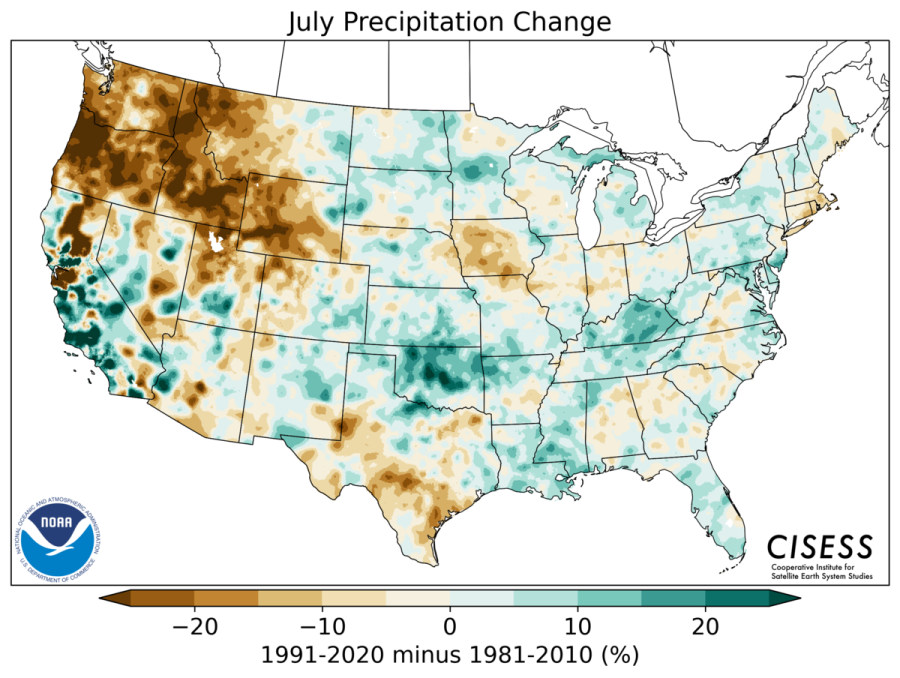
We will pull out two months that are very much noticeable adjustments to the climate normals for Portland and the PNW. The July maximum temperature change for Oregon is anywhere from .5 to 1.5 degrees in Oregon. The real sore thumb is found in the July precipitation change for Washington and Oregon. If you use the slideshow to look at that, you can see how dry the PNW is compared to our last 30 year period. The Willamette Valley and areas out to the Oregon coast are sitting in the -25 percent category. If you’ve been around the region for some time, you know that July 4 is the timeframe that we look at for conditions to start drying out around here. Well, there is no doubt with this information that July is definitely a marker for that.
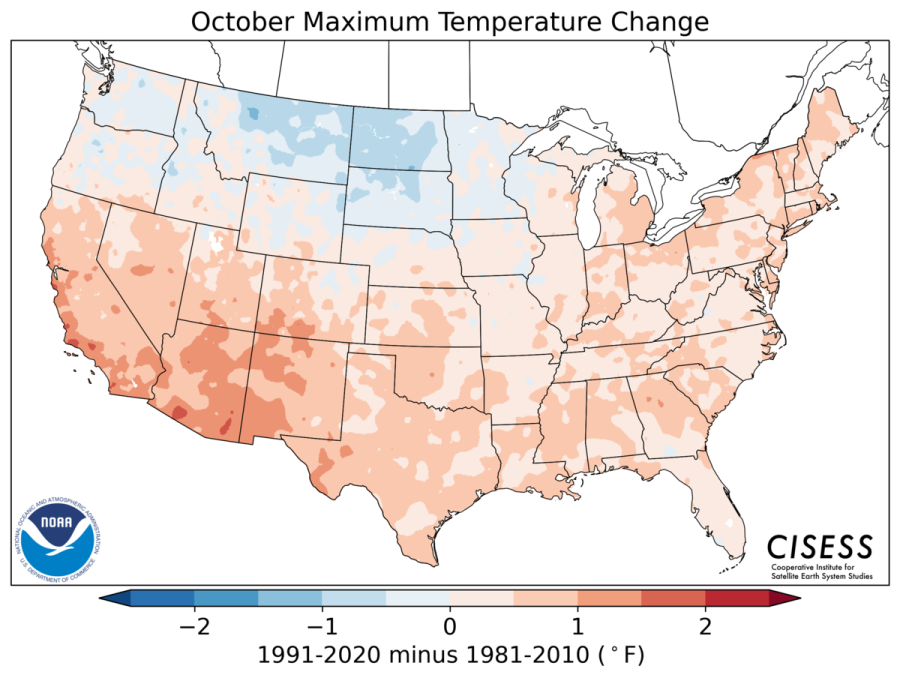
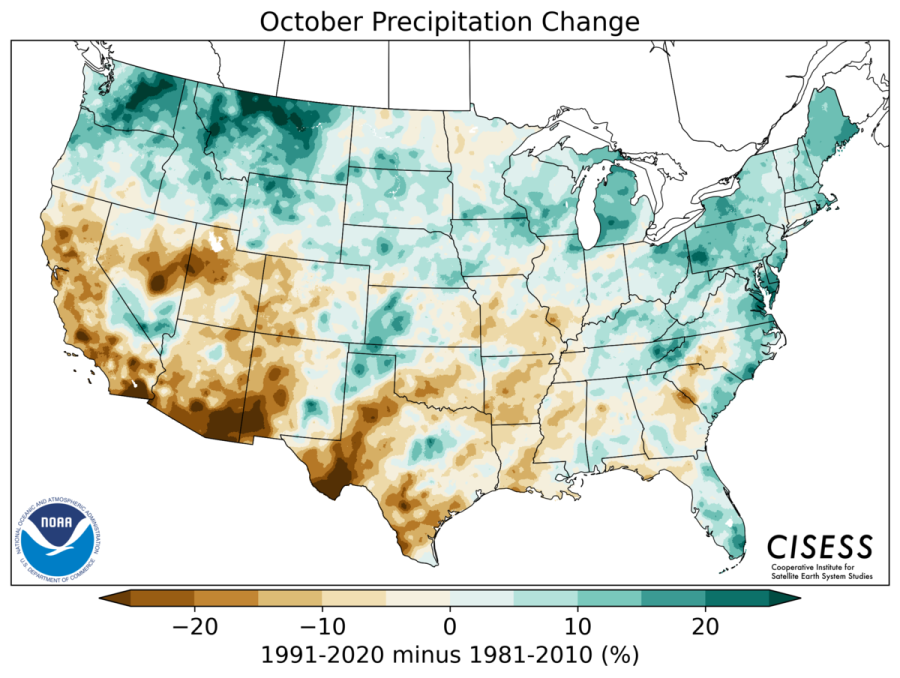
Let’s fast forward to fall and take a look at October’s maximum temperature change and precipitation change. The notable difference here is again going to be the precipitation change for the PNW. Although the temperatures are slightly warmer, the precipitation change is in the 10 to 20 percent range. Are we seeing atmospheric rivers coming in that are warmer and holding more moisture? We have had some very wet Halloweens the last 10 years, which have been attributed to strong atmospheric rivers, 2015 especially.
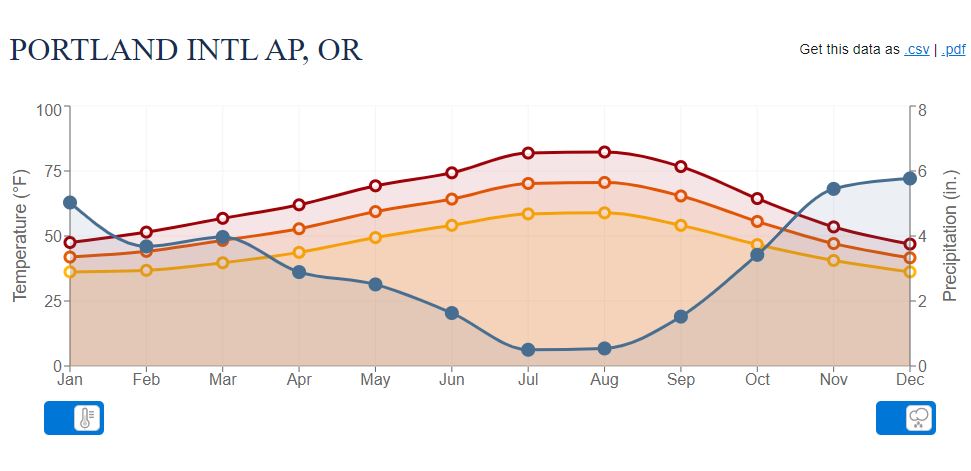
Below is a snip of a graph that was put together from the NCEI of the temperature and precipitation norms for the Portland International Airport here in Oregon. I just wanted to give you an idea of this graph, but it hasn’t changed much. The blue line is the precipitation, which we know is going to take a swift drop in the summer months, meanwhile, December is getting close to 6 inches (5.77 inches) of precipitation, which is the wettest month on average for us.
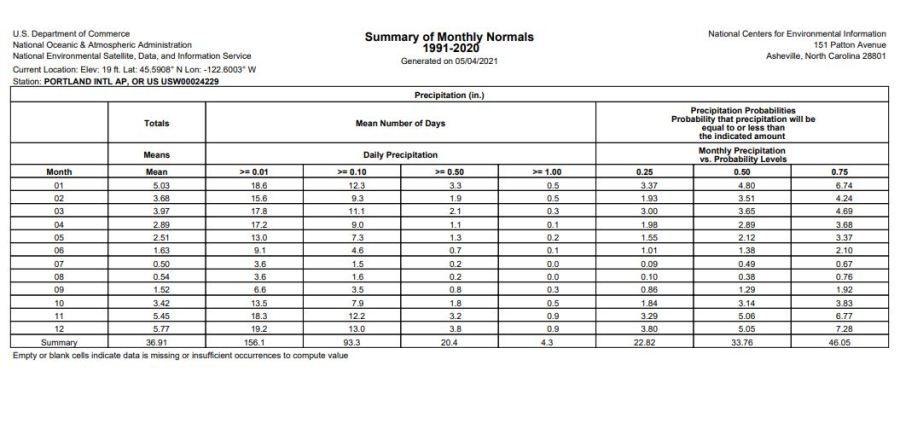
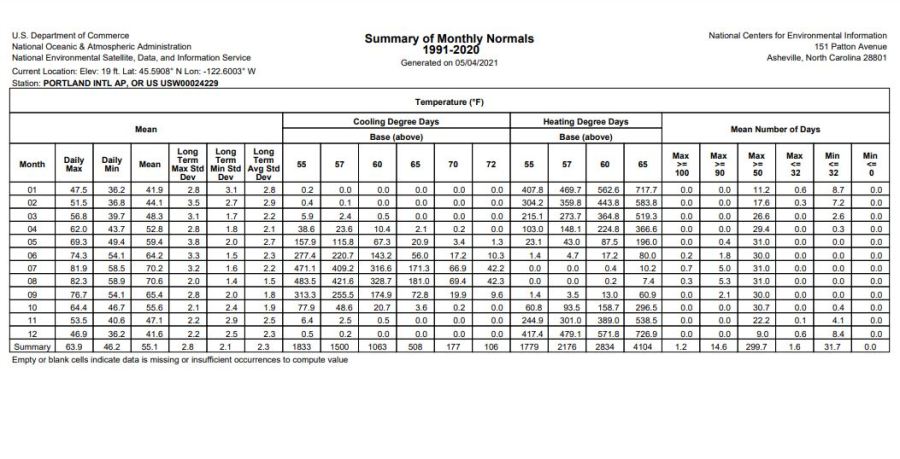
Below are two charts that will help show the information that is in the graph below, but with numbers. You can also access this data here. The first image in the slideshow is showing the precipitation stats for us in Portland. As expected, both July and August remain very dry on average. July has an average rainfall of 0.50 inches and August 0.54 inches. The yearly average comes out to 36.91 inches, which is slightly more than the 36.03 inches from 1981-2010. That is partially due to the boost in the month of October.
Does this stand out to you? Have you been around the region since the early 80s and noticed these changes? That is why this type of information is important for us to have. It gives us context for the extremes that we may encounter. The 30 year climate normals are helpful for forecasting and understanding expectations around here. We have to wait until 2031 for our next batch of information, but we already know that our April 2021 is the driest April on record in Portland and our current spring may end up being the driest spring on record. According to our new 30 year climate normals, the months of March, April and May in Portland should be close to 9.37 inches of rain and we are currently sitting at 2 inches as of May 4, 2021. That tells you how dry we are this spring and it would take an additional 7.37 inches this May to bring us to that new 30 year average.
You can read more about our dry spring here.
NCEI of NOAA helped contribute to this article


